The monitoring and management of inclusions are central to the steelmaking process and vital for organizations looking to ensure the appropriate quality and properties of steel products and minimize cost.
In this interview, Jean-Marc Böhlen from Thermo Fisher Scientific provides a useful summary of the issue of inclusions in steelmaking and highlights the importance of controlling these. Jean-Marc Böhlen explains some of the underlying principles of ultra-fast analysis of non-metallic micro-inclusions using the Thermo Scientific ARL iSpark Optical Emission Spectrometer, its advantages and benefits, and details some of its applications.
What are inclusions, and what impacts do these have on the steelmaking process?
Inclusions, also known as non-metallic inclusions, are tiny particles embedded in the steel matrix. Inclusions are said to be endogenous when they are formed by chemical reactions in the liquid steel and exogenous if they appear in the liquid steel in contact with refractories or slag.
Inclusions exist in a wide variety of compositions, for example, oxides, sulfides, silicates, and nitrides. They are also characterized by their size, which goes from microscopic to macroscopic, and by their morphology, which can be globular, hexahedral, or dendritic.
In steel production, there are several major reasons to pay special attention to inclusions. First of all, inclusions modify the metal matrix. This can dramatically affect the properties of the steel, such as fatigue resistance, weldability, formability, machinability, or corrosion resistance. Some inclusions are intentional because their presence imparts very specific properties to the steel. For example, manganese sulfate inclusions are important to ensure the machinability of free-cutting steel.
However, in many cases, inclusions are undesirable because they have a negative effect. These effects range from non-conforming steel properties, sometimes due to defects caused by inclusions at rolling mill, to finished product failures, for example, breaks of automotive parts, and manufacturing process problems. They can result in heats being scrapped or degraded and can even lead to claims of unsatisfied customers.
In general, too many and too large inclusions are detrimental to the properties of steel. Secondly, inclusions can have a negative effect on the smooth running of the manufacturing process. For example, a prevalent issue for steelmakers is the clogging of the submerged entry nozzle during continuous casting by aluminum oxide inclusions.
The consequences of issues due to inclusions can be extremely costly. This is especially true since inclusions are always present in steel and their population is difficult to keep under control, as it is very much subject to hazards, fluctuations in the production process, or variable quality of the raw materials. For a steel plant, inclusions, therefore, constitute a permanent economical challenge.
To guarantee steel properties, and minimize process issues and production cost, it is essential to have an instrument that allows rapid analysis of inclusions during production to ensure that the chemical composition and size distribution of the inclusion population is acceptable. The ARL iSpark Optical Emission Spectrometer has this capability.
What are the techniques commonly employed for inclusion analysis, and what advantages does the ARL iSpark have over them?
Steelmakers use a wide range of analytical methods to control inclusions and avoid quality and process issues. Nowadays, the reference technique is SEM/EDX, which combines scanning electron microscopy and energy-dispersive X-Ray fluorescence. SEM/EDX has the advantage of being quantitative and compliant with inclusion analysis norms. However, the sample must be carefully prepared by polishing and the analysis time is long. The inclusion analysis results cannot generally be obtained in less than an hour, rendering it unsuitable for effective control during steel production.
For the analysis of micro-inclusions, typically less than fifteen or twenty microns in size, the ARL iSpark spectrometer offers a much faster alternative, using a technique known as Spark-DAT. With Spark-DAT, the ARL iSpark becomes a two-in-one instrument that combines high-performance elemental analysis and inclusion analysis into one analysis. The results of both analyses are obtained simultaneously, in record time, equal to that normally required for elemental analysis alone. Thus, in a steel mill laboratory, where the analysis is the average of two measurements, the inclusion data is obtained in less than a minute.
Another advantage provided by the ARL iSpark is the sample preparation. The standard optical emission surface preparation techniques, milling, and grinding are suitable for inclusion analysis, eliminating the lengthy surface polishing needed in SEM/EDX. The overall analytical cycle is therefore very short, typically taking less than ten minutes from sampling the liquid steel to obtaining inclusion data. This can almost be considered on-line inclusion analysis. This is necessary to analyze inclusions in hundreds of samples on a daily basis, as required for effective inclusion control in production, but it can be very useful in any situation where the laboratory needs to analyze a very large number of samples in record time.
It should also be emphasized that the instrument is a standard ARL iSpark, with no additional hardware equipment. On the one hand, this means that the investment required for the inclusion analysis is extremely low compared to the huge cost savings that such an ultra-fast inclusion analysis makes possible. On the other hand, it means that the instrument is simple to use, and no specific operator training is required.
Finally, I would like to mention that inclusion analysis with the ARL iSpark is fully suitable for automated analysis using ARL SMS-2300, ARL SMS-3300 or ARL SMS-3500. These sample manipulation systems take care of all the relevant operations, from sample preparation to analysis, as well as running control, setting up, and type of standard samples.
You said that the deleterious effects of inclusions can be extremely costly for a steel plant and that huge savings are possible. Can you say more about that?
Just over a decade ago, Thermo Fisher Scientific joined up with a group of experts from several leading European steel companies in a project on inclusion analysis with optical emission funded by the EU. These experts gave examples of the savings that are possible thanks to such a fast inclusion analysis method.
At the time, they estimated that avoiding a claim from a customer unsatisfied with the quality of the steel that they received saved an average of €80,000 and that avoiding a bad steel heat saved an average of €100,000. These numbers are even higher nowadays.
Considering that several customer claims and bad heat could be avoided each year by controlling inclusions with their optical emission spectrometer, they agreed that a yearly saving of one million euros or more is possible. This guarantees an extremely fast return on investment and fully justifies acquiring an instrument capable of performing elemental and inclusion analyses simultaneously.
According to these companies, such big savings can be achieved by effectively monitoring inclusions at various stages of the process, particularly during secondary metallurgy, continuous casting, and on the final product. At the secondary metallurgy stage, rapid inclusion analysis by optical emission allows for quick action to correct non-ideal inclusion contents. At the continuous casting stage, it can provide early warning signals to help prevent problems such as nozzle clogging. When it comes to the finished product, optical emission simply offers a unique, low-cost solution for systematic inclusion control.
What are the underlying principles of inclusion analysis using the ARL iSpark?
Inclusion analysis is based on similar instrumental principles as the classical elemental analysis. For this reason, the two methods can easily be combined in a single analysis.
Let me first explain in very simple terms how optical emission works. Short sparks repeated at relatively high frequency are used to ablate and atomize a small portion of the sample and to generate plasma in the argon-filled analytical chamber. In the plasma, the atoms ablated from the sample emit light signals which are characteristic of the elements present in the sample and their concentrations. The light signals are transformed into electrical signals by the detectors for acquisition.
This applies to both elemental and inclusion analyses. The main difference between them is in signal processing. In elemental analysis, the sample is considered from a macroscopic point of view, and the electrical signals are converted into the concentrations of the elements present in the sample, using calibration curves.
Inclusion analysis does not require specific calibration, for which standard reference samples do not exist. Instead, processing of the signals by specialized statistical algorithms is used. Processing the signals in this way reveals the strong variations in the concentration of elements at the microscopic level, which are caused by the presence of inclusions. In short, very useful inclusion data can be obtained.
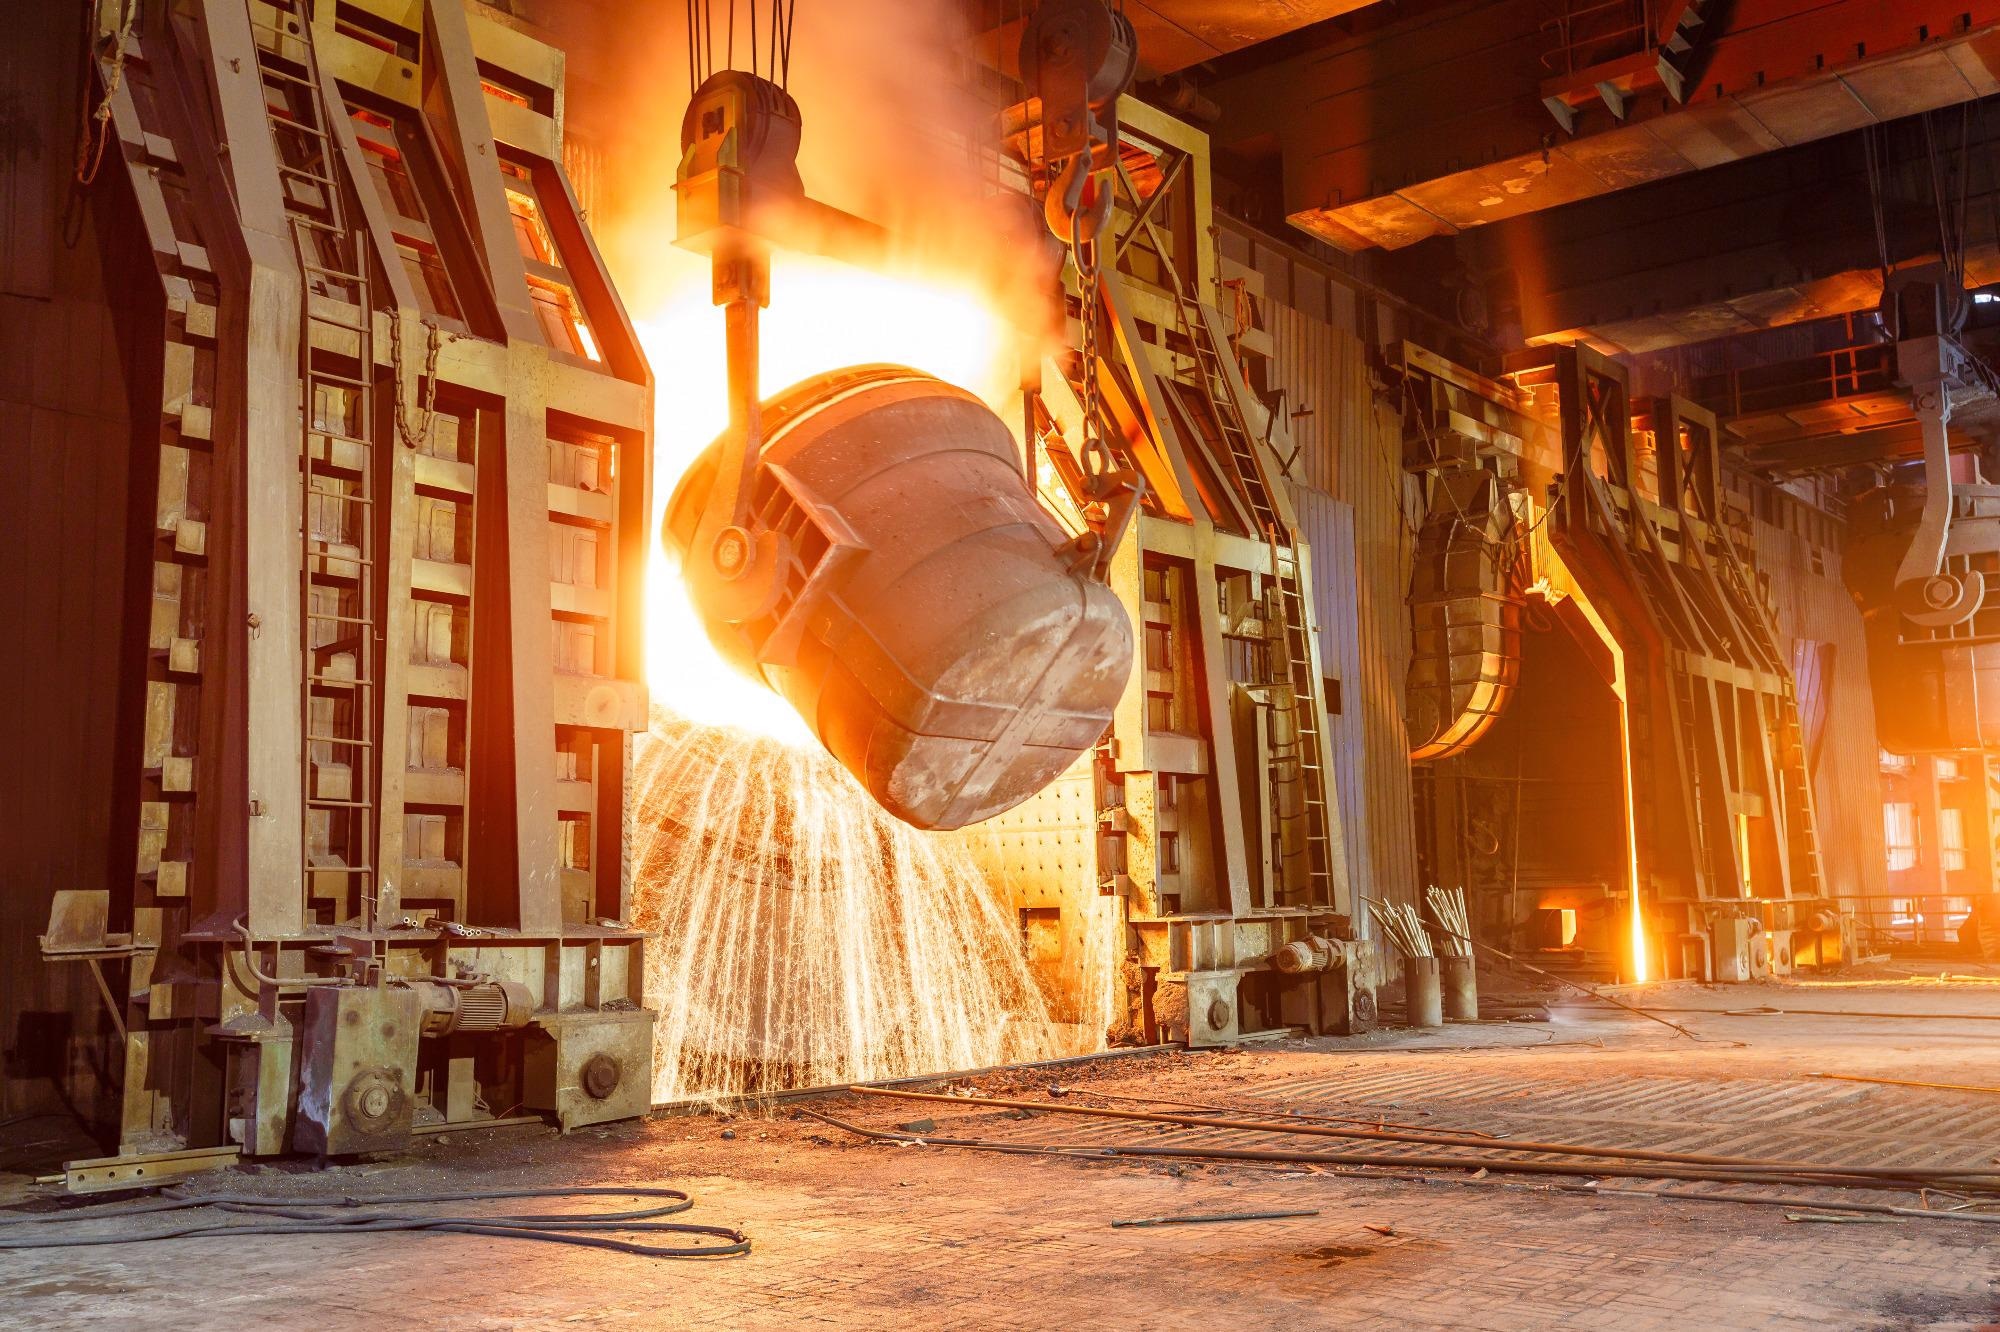
Image Credit:Shutterstock/ABCDstock
Can you tell us what kind of inclusion data can be obtained with the ARL iSpark?
In general, the ultra-fast analysis of inclusions with the ARL iSpark offers the possibility to quickly check, at any time, at any stage of the production process as well as in the finished product, that the inclusion population is in accordance with the requirements for the steel grade and its end use, or that a smoothly running production process is guaranteed. Many different applications are therefore possible. Let me just mention two great applications of the ultra-fast inclusion analysis with the ARL iSpark.
The first one should be of interest to many steelmakers, as it allows optimal control of inclusion modification by calcium treatment and helps reduce the number and frequency of problems such as nozzle clogging. When aluminum is added to de-oxidize steel, aluminum oxide inclusions are formed. These little crystalline particles are responsible for the clogging of the submerged entry nozzle. Calcium is added to modify them into calcium aluminates. These aluminates, liquid at the temperature of the liquid steel, are easily eliminated by migration into the slag, thus reducing any risk of nozzle clogging. The addition of a sufficient amount of calcium guarantees the modification of the aluminum oxides.
However, if the addition is excessive, a second, undesirable modification can occur, which manifests itself in the appearance of calcium sulfide in the composition of the aluminates. These new inclusions reduce the fluidity of the liquid steel, which causes problems during casting.
The ARL iSpark provides a very simple method to make sure that inclusion modification is under control and issues due to nozzle clogging and insufficient steel fluidity are minimized. Due to the ease of use and the rapid results, the ARL iSpark can be used to monitor aluminum oxides and calcium sulfides frequently throughout the steel manufacturing process. Their number must always remain as low as possible. When the number of aluminum oxides increases, the steel plant knows that more calcium must be added to the melt. On the other hand, when the number of calcium sulfides increases, the company knows that calcium addition must be reduced.
it must be noted, however, that the most effective and simple control of inclusion modification is performed using SPC Statistical Process Control software, which is able to generate warning signals when the number of aluminum oxides or calcium sulfides increases critically or exceeds tolerance limits.
The second application allows the ARL iSpark to determine the oxygen content in killed steels at concentrations down to a few ppm. It is well known that optical emission in its classical form, based on calibration with certified samples, is not sensitive enough to quantitatively determine the concentration of oxygen below forty to fifty ppm, levels which are required in some special steels. For bearing steels or interstitial-free steels, for example, combustion analysis is normally used, which is costly and time-consuming. In steel, oxygen is mainly insoluble, which means that most of the time it is present in inclusions.
The iSpark ARL allows a large amount of information on the various types of oxygen-containing inclusions to be collected, such as their compositions, average sizes, and numbers. This information is used to calculate the total oxygen content. Using this method, the iSpark ARL is able to determine oxygen levels rapidly and accurately and reduce or even eliminate the need for combustion analysis. This was demonstrated with certified carbon and low alloy steel reference materials with oxygen concentrations between 5 and 30 ppm, and it is used by many of our customers. Interestingly, in the absence of standard reference samples for inclusions, our method also provides a useful validation of our inclusion analysis methods.
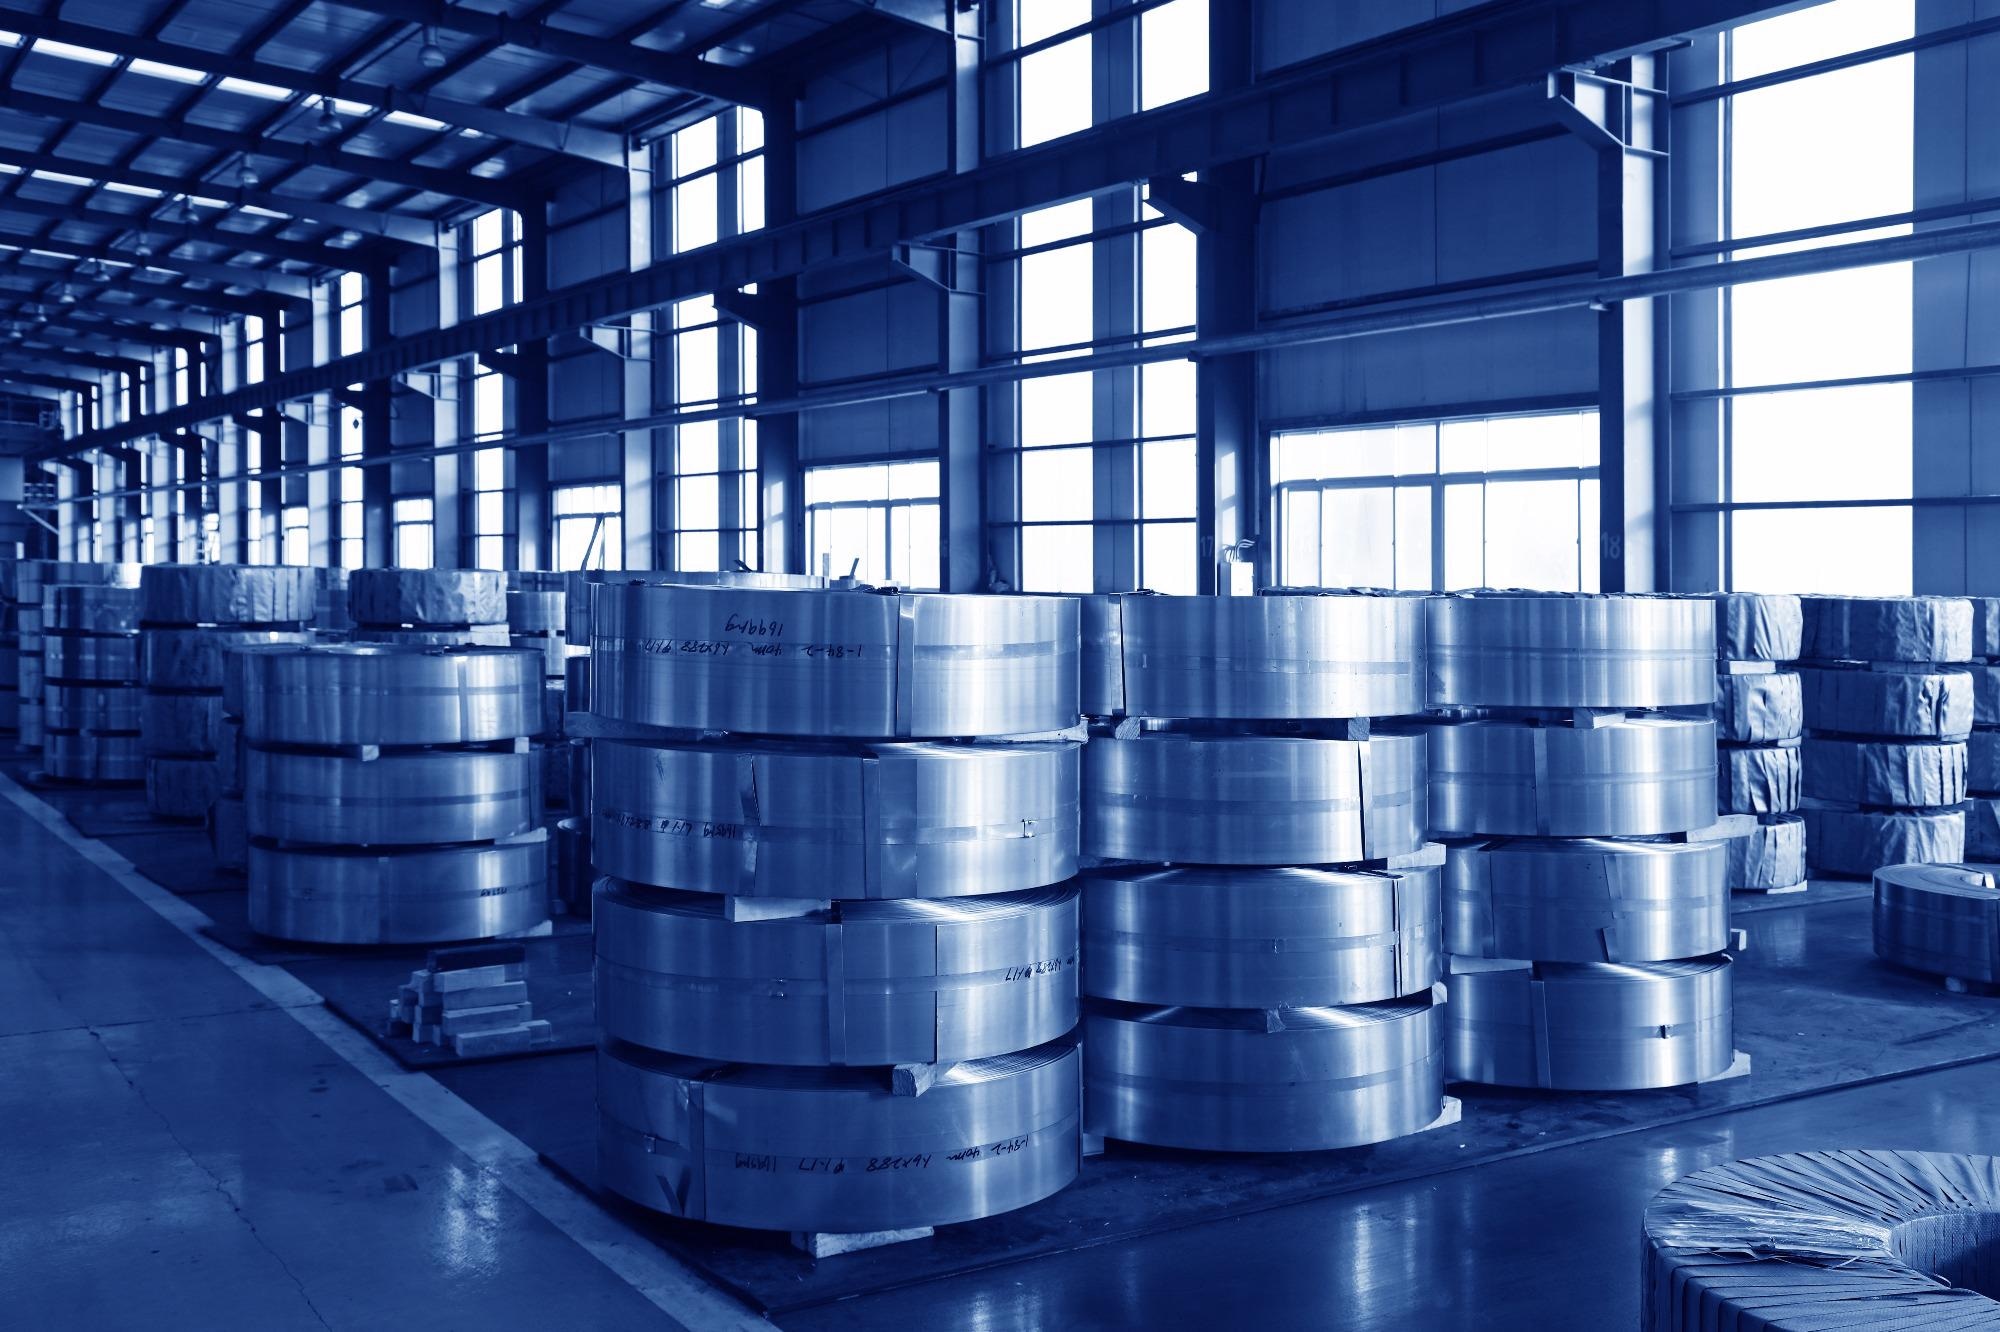
Image Credit:Shutterstock/YuangengZhang
What about the software used for inclusion analysis? We know that it is an essential piece of a modern spectrometer.
The software is essential. Only a very good software can get the best out of the instrument, and this is of course true for inclusion analysis.
OXSAS, the analytical software of the ARL iSpark, is the centerpiece of inclusion analysis, as it is for elemental analysis. It fully integrates all the features needed to create and set up the analytical method and run inclusion analysis in combination with elemental analysis. It also manages other important aspects like storage and transmission of the results. Particularly important for the inclusion analysis are the fast Spark-DAT algorithms, that allow high differentiation of inclusions in terms of composition and size.
There are also software modules dedicated to the analysis of inclusions, namely Spark Explorer, Inclusions Report, Ternary Diagrams, and, of course, SPC software, which is the first-choice tool for inclusion analysis.
The Spark Explorer includes a set of graphical software modules for offline work. This tool is very useful for off-line examination of raw inclusion data in detail, for example, in case of critical issues with steel quality or manufacturing process. The Spark Explorer is also useful for optimizing the parameters of the Spark-DAT algorithms, comparing raw inclusion data of different samples, or documenting inclusion analysis.
The Inclusions Report generates a compact, customizable document that includes details of the analysis method, the chemical composition of the sample and the properties of the inclusions measured. It is ideal for reporting the results of an inclusion analysis to experts in R&D, process scientists or defectology specialists, or documenting and archiving inclusion analyses.
The Ternary Diagrams module allows eponymous diagrams to be obtained. These diagrams, which are very popular with inclusion experts, allow, for example, rapid visual control of the inclusion modification at calcium treatment.
As mentioned earlier, SPC statistical process control software is a prime tool for inclusion analysis. Frequently used with optical emission instruments for controlling elemental composition, it can also be used for any type of inclusion data. I highly recommend SPC software to those steel plants that want to minimize non-compliant products, rework, and scrap or minimize process issues like clogging of the nozzle.

This information has been sourced, reviewed and adapted from materials provided by Thermo Fisher Scientific – Materials & Structural Analysis.
For more information on this source, please visit Thermo Fisher Scientific – Materials & Structural Analysis.
Disclaimer: The views expressed here are those of the interviewee and do not necessarily represent the views of AZoM.com Limited (T/A) AZoNetwork, the owner and operator of this website. This disclaimer forms part of the Terms and Conditions of use of this website.